Part One · How the Lab Works
The Reframe: The Lab Is a Loop
Start with the mental model, because it organizes everything that follows. A modern discovery lab is no longer a room full of benches. It is a closed loop with four steps, and the whole industry is a race to spin that loop faster.
Design: an AI proposes a molecule, a protein, an experiment. Make: the candidate is physically synthesized. Test: instruments measure what it actually does. Learn: the results feed back and sharpen the next design. Design, Make, Test, Learn. Every self-driving lab, every AI-drug-discovery startup, every pharma automation program is an attempt to run that cycle with less human hand and shorter turnaround.
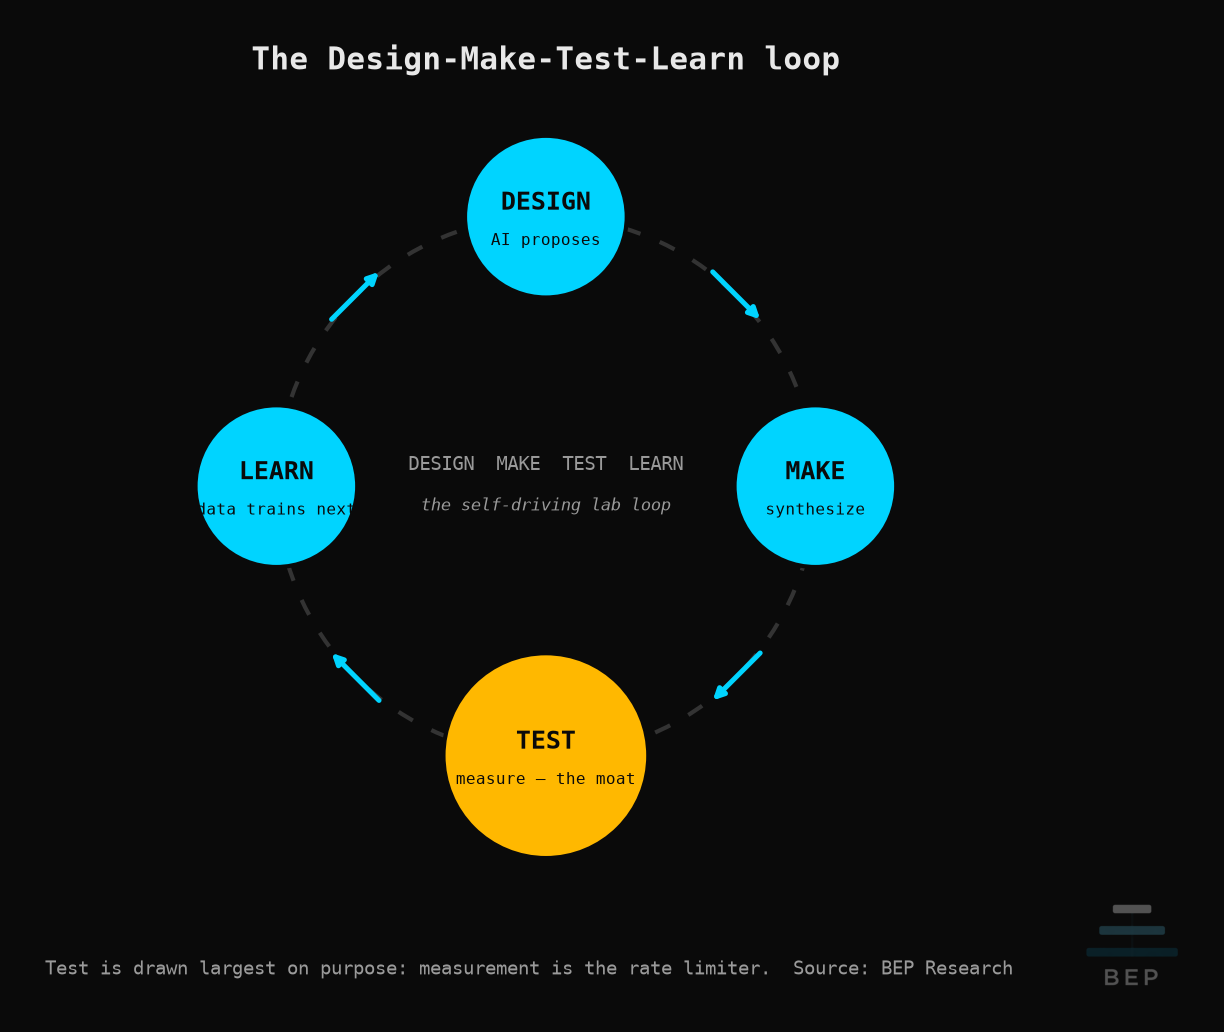
The market gets one thing backwards about that loop. Venture money, headlines, and the Nobel Prize all flow to Design, to the model. And Design is real. But it is also the least constrained step in the cycle. Structure-prediction models diffuse in months, every serious lab rents the same GPUs, and the algorithms are close to a public good.
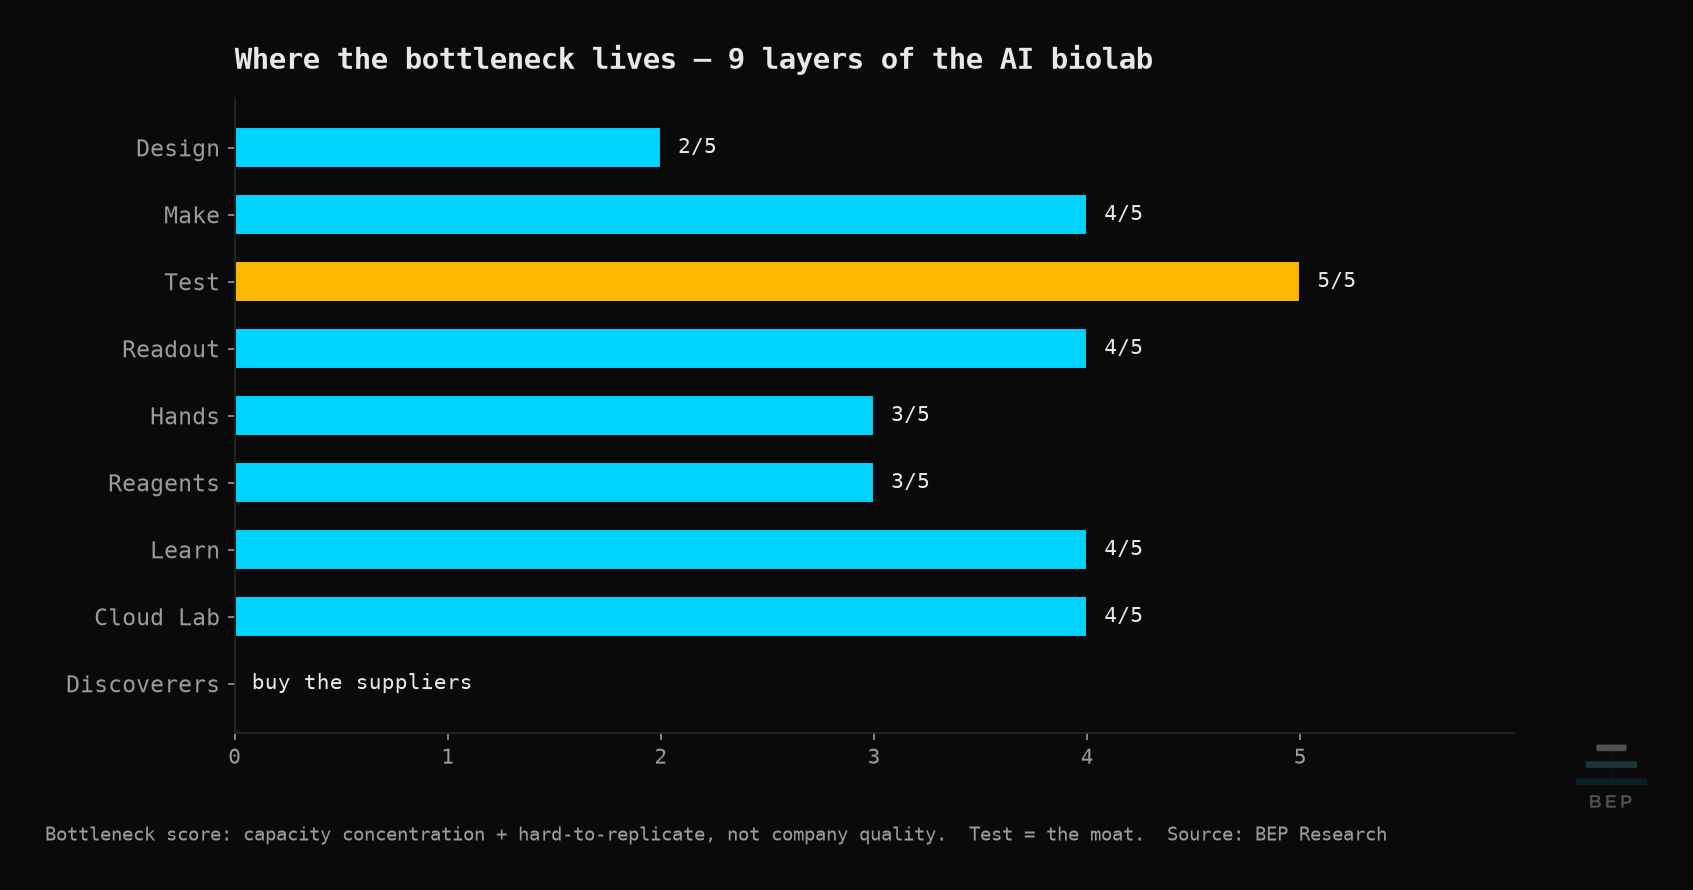
The binding constraint is Test. A model can propose a billion molecules for the cost of electricity. Finding out which ones actually bind, fold, permeate, and do not kill a cell still requires physically measuring them, one assay at a time, on instruments that cost as much as houses and are built by a handful of companies. The scarce input to a great biology model is not compute. It is measured experimental data at scale, and that data comes out of the measurement layer. The evidence through the rest of this primer points the same way, so I will say it plainly and let the stack earn it: the moat is the measurement.
Readers of this letter will recognize the shape. The bottleneck is rarely the layer the market is staring at; it migrated from the GPU to memory, packaging, and power in the datacenter. The same logic applied to the lab points at the instruments.
© BEP Holdings · Ben Pouladian. Research and commentary, not investment or medical advice.